
AI Insights by Certilytics
From Deep Learning to GenAI: A History of Data Science Innovation at Certilytics
How We’re Bringing the Latest in AI Advancement to Healthcare

SHARE IT :

Deep learning will eventually replace most of the regression models so widely used for risk prediction in the healthcare industry today. We describe here a history of deep learning findings at Certilytics—culminating in our latest innovations in the GenAI space—using choice examples spanning eight years of research, development, and operational experience. These proofs of concept (POCs) turned models, turned products, share in common a three step approach to adapting cutting edge machine learning techniques to healthcare: (1) Translation of medical data into flexible documents based on standardized medical ontologies/vocabularies; (2) Application of semi-supervised learning techniques to create universal data representations for transfer learning to specific problems; (3) Development of healthcare specific quality assurance (QA) strategies to ensure models are accurate, clinically valid, and unbiased. We describe a range of models, from early healthcare embeddings trained with word2vec to our latest GPT language models, to show the evolution of our approach to deep learning in healthcare and the promise it has to improve legacy models and enable new modeling domains.
Introduction
The healthcare risk modeling market is dominated by legacy regression models (Hileman and Steele 2016), even after deep learning approaches have found so much success in other industries. There are several reasons why healthcare lags behind other sectors:
- Patients, the unit of analysis for most risk models, are already described in a reasonably linear separable feature space in healthcare data. Data ontologies like diagnosis codes, procedure codes, and drug codes are defined at the patient level and, though certainly not independent, do pretty well in linear models with the help of ubiquitous episode groupers.
- Linear models, despite their lack of capacity, are extremely transparent. One can audit the exact weight assigned to a given input variable and subject it to clinical review—an important consideration in healthcare.
- Incumbent models, once integrated into actuarial and other workflows, become a cornerstone of otherwise conservative, slow-moving processes and infrastructure.
Still, none of these barriers negate the potential (now proven) value of applying deep learning to healthcare—not only to improve legacy risk models but to bring whole new problem domains into the purview of automated machine learning solutions, like payment accuracy and provider care pathways analysis.
In the current article, we review the progression of deep learning models and use cases at Certilytics over the last eight years through a handful of illustrative examples. Much of the work was prototyped and performed by a dedicated Labs team, whose purpose continues to be bringing the latest in machine learning techniques to bear on healthcare problems through POCs and prototypes.
2018: Member Deep Representation (mDR), a semi-supervised representation learning approach
2018 saw deployment to production of our first suite of models trained using Member Deep Representation (mDR), a 250-D dense vector representation of member medical histories trained through unsupervised representation learning (Figure 1).
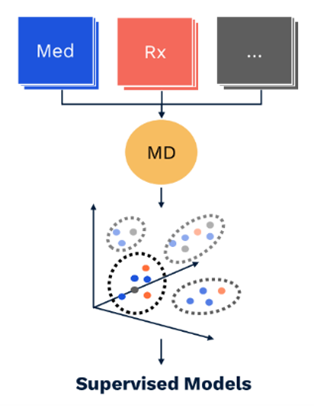
Figure 1 mDR schematic. Data domains like Med (blue) and Rx (red) claims are first combined in flexible, semi-structured member documents (MD, yellow), using tokens based on medical ontologies. These flexible documents are then mapped into a (relatively) low dimensional dense vector space, the mDR space, using representation learning. This space can be conceptualized as a machine learning derived medical concept space, where similar members map to similar locations. The position of a member in mDR space can then be correlated to various outcomes of interest by adding heads comprising supervised linear or dense layers, a form of transfer learning.
Initial versions of mDR leveraged the word2vec (Mikolov et al. 2013) and doc2vec (Le and Mikolov 2014) embedding algorithms, both of which had proven extremely valuable in semi-supervised language applications. These earliest forays into deep learning set a pattern for next generation healthcare model development that we still use today:
- Translation of medical histories into flexible document structures comprising medical ontologies like ICD-10 diagnosis and procedure codes, GPI drug classes, and other billing codes.
- Semi-supervised modeling of documents, usually with an unsupervised pre-training step, followed by supervised learning or fine-tuning. These models rely heavily on Natural Language Processing techniques like word embedding, sequence modeling, machine translation, and GPT (Bahdanau, Cho, and Bengio 2015; Cho et al. 2014; Radford and Narsimhan 2018).
- Extensive healthcare QA, which goes beyond traditional performance metrics like R2 values and C-statistics and focuses on clinical validity, transparency, and bias.
The semi-supervised approach has numerous benefits, which we detail later. One worth noting in particular is the ability to perform extensive QA of the latent space itself, establishing the clinical validity of AI-derived concept associations. This is most easily conceptualized in the case of word embeddings.
As one illustration, we queried the mDR latent space for synonyms of a CPT code for intravenous chemotherapy using cosine distance (Mikolov et al. 2013; Bakarov 2018a). This returns clinically related procedure codes from two different ontologies (CPT and HCPCs), along with an ICD-10 diagnosis code for adverse reactions to chemotherapy (Table 1) (Dwyer et al. 2023)*.
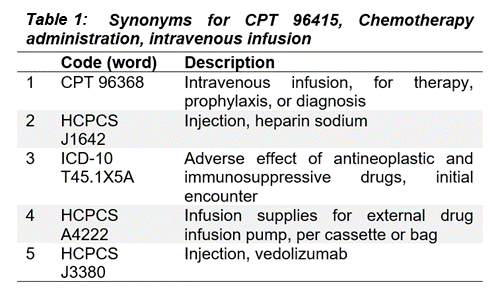
Through this kind of spot-checking, we can show the clinical validity of the relationships implied by mDR mappings to the latent space.
We can also take a more global approach, systematically sampling tokens and comparing cosine similarities with clinically related token sets defined by clinical conditions (Bakarov 2018b; Torregrossa et al. 2020; Wang et al. 2019). In our case, we used Certilytics CORE® Episode Grouper to define condition-based token sets. We developed a purity score, to quantify the degree to which the intra-condition tokens are more alike than inter-condition tokens. We even show that purity improves when mDR is trained on larger data sets (in Figure 2, Client B is roughly 20-times the size of Client A), though mDR performs surprisingly well even when trained on small data sets based on the accuracy of downstream supervised models (P. D. VanMeter 2022)*.
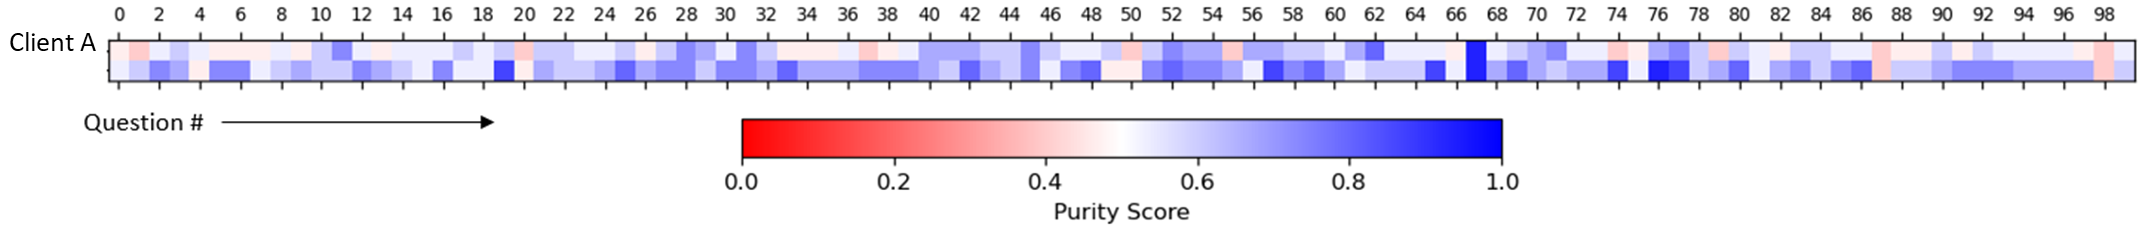
Figure 2 Global analysis of mDR embeddings. Purity scores, which quantify the nearness of clinically related tokens in mDR space relative to unrelated tokens, are given across 100 common CORE® conditions (Questions) for two clients, A and B. Separate mDRs were trained for each client to understand the relationship between data volume and global mDR performance. Client A is small, with fewer than 200k continuously eligible lives. Client B is large, with over 20M.
By establishing the clinical validity of deep learning representations, we have overcome the barrier of “black box” models in healthcare and developed an array of QA tools for assessing such models.
mDRs bring a variety of powerful improvements to healthcare risk models (Dwyer et al. 2023):
- They reach and usually exceed the performance of risk models trained to hand crafted tabular feature sets. The Certilytics diabetes onset prediction model, for example, exhibited an increase in C-statistic from 0.826 to 0.841 with the introduction of mDR.
- As we have already seen in Table 1, mDRs achieve organic integration of codes across ontologies, obviating issues of collinearity and enhancing the synergistic effects of multiple data domains.
- In particular, integration of data domains leads to increased robustness to missing data. This makes intuitive sense: If diabetes diagnosis codes map to a similar position as diabetes therapies in mDR space, loss of Rx data should not materially impact models, assuming the diagnosis code for diabetes is still present—at least not compared to tabular models. Indeed, we have systematically shown that mDR models trained on Med+Rx data perform better on average in Med-only data scenarios than tabular models trained specifically for this task.
- By providing downstream supervised models with a common clinical representation, mDR reduces the risk of contradictory model findings and, as we have seen, unifies QA.
- Finally, from an efficiency perspective, mDR drastically reduces the time it takes to train and deploy models by leveraging automated representation learning for the manual task of feature creation. In the mDR paradigm, users only have to specify tabular targets and filter criteria.
While we have moved far beyond word2vec since 2018, representation learning, unsupervised pre-training, semi-supervised learning, and deep representations are foundational to all Certilytics products today.
2020: Provider Deep Representation (pDR), a means to improve member risk models in low data scenarios
Provider analytics lag far behind member analytics in healthcare. One consequence is a lack of readily defined tabular provider features. Where members have extensive episode groupers and quality measures, e.g. HEDIS, from which to build tabular, linearly-separable data, providers have very little. As a result, machine learning solutions incorporating provider information are scarce.
As a means of improving member risk prediction in low data scenarios, like new exchange members, we sought to incorporate provider information into member risk models. We reasoned that while we may know little about a new member’s history early in the plan year, we could infer a great deal of information about their severity and likely treatment pathways by summarizing the treatment patterns of their known rendering providers. For instance, knowing a member is seeing an orthopedic surgeon with higher costs and worse outcomes than her peers might prove valuable in predicting future risk.
Following the general approach outlined above, we began by creating provider documents as collections of the diagnosis and procedure codes billed to their attributed patients. These provider documents were designed without provider specific information, so they could be applied to new providers in production. With provider documents in hand, we could then leverage sequence modeling architectures useful for language modeling.
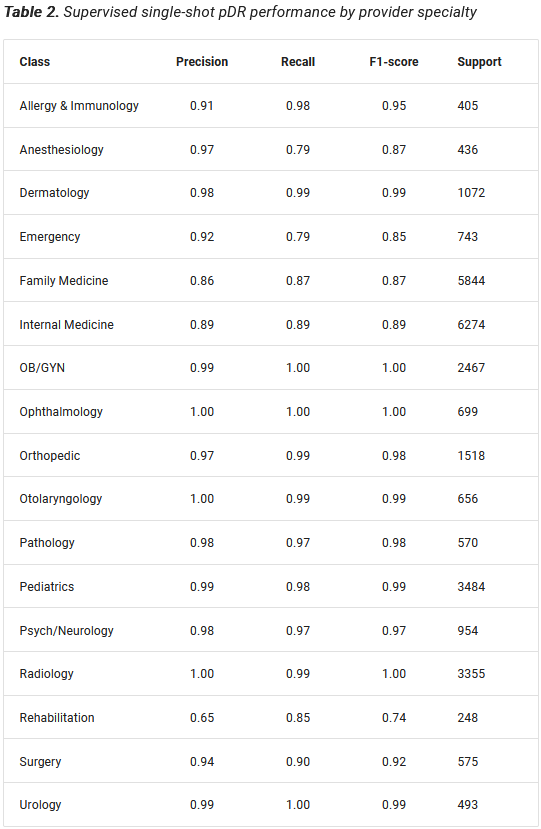
We created a pDR using a supervised network based on GRUs (Cho et al. 2014) to predict provider specialty, which we could look up definitively using provider NPI. We reasoned that a model that could learn to predict provider specialty from a sequence of granular diagnosis and procedure codes would learn to map providers to a meaningful latent space that could be transferred to other tasks, including member risk prediction. Moreover, the supervised nature of the pDR provides a ready internal measure of clinical validity. The supervised pDR model achieved remarkable performance across provider specialties (Prybol and Dwyer 2020)*, with F1-scores between 0.74 and 1.00 (Table 2).
pDR proved immediately useful, allowing us to accurately impute provider specialty on data that lacks a definitive provider identifier. But our real interest was always in transferring the pDR latent layer to improve member-level predictions.
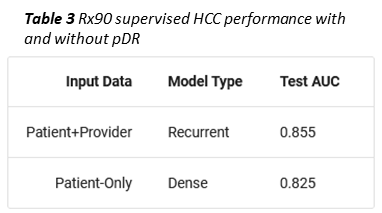
As an example, we trained a second, supervised member-level model to predict whether a given member would become a high cost claimant, i.e. exceed $100k in total allowed amount, in the coming year. To simulate a limited data scenario, members were represented with only 90 days of Rx data (Prybol and Dwyer 2020)*. Under these conditions, concatenating a provider vector (obtained using an RNN to collapse all of a member’s pDRs into one vector) to the mDR improved high cost claimant prediction by ten percent (Table 3).
Coming off of our success with mDR, the pDR model showed how deep learning could be used to open up new problem areas to machine learning, in this case classifying and representing providers, which we treat more completely in the next section.
2020: Care pathways, procedural grouping, and the power of GenAI
2020 saw the start of a long arc of Labs research aimed at fully characterizing the member-provider interaction through definitive care pathways. Historically this has been the purview of procedural groupers, which characterize pathways in rudimentary terms, like “with or without admission.” The barrier to more complete characterization is the complexity of the pathways themselves. Clinicians trying to enumerate care pathways based on first principles quickly find the problem combinatorically intractable, and the problem of classifying pathways certainly exceeds traditional machine learning approaches.
Over the last several years, we have tested a variety of deep learning approaches, from autoencoders, to sequence modeling architectures and multitask learning with unsupervised and supervised branches. While we were able to make remarkable progress within conditions—identifying unique pathways for anxiety and breast cancer, for example (P. VanMeter 2022)*—it was not until 2023 that our work with GPT led to a complete solution, which we term CORE® GPT (P. VanMeter 2023)*.
CORE® GPT Clinical Pathways predicts the exact sequence of member utilization at the CORE® condition level. This approach has several important benefits over prior architectures:
- Instead of predicting high level care pathway groups, it identifies member specific pathways at the procedure code level;
- This in turn enables a much more detailed and rigorous comparison of member pathways, which can inform both member predictions and, when members are aggregated to the provider level, provider practice patterns. Indeed, using a single model for both applications would forge a foundational link between member risk and provider analytics, which we have long sought but never done more than report on high level quality metrics;
- Pathways no longer need to be predicted with separate models for every CORE® condition. We can train a single model for all pathways and conditions;
- Clinical SME review is no longer required for every set of condition groupings. Instead, we can leverage global clinical QA.
An example pathway prediction is given in Figure 3 for the preventive services CORE® category, compared to the actual pathway (P. VanMeter 2023)*. The CORE® Clinical Pathway GPT model was provided the first ten tokens of the member-condition document, including age, gender, and a sequence of procedure codes. The next ten codes were generated by the model as a prediction for the next sequence of member utilization. Remarkably, the codes are identical and the sequences differ in only the order of the Flu and measles vaccines (Figure 3). This provides a striking illustration of the potential for sequence based language modeling and GenAI to learn complex care pathways.
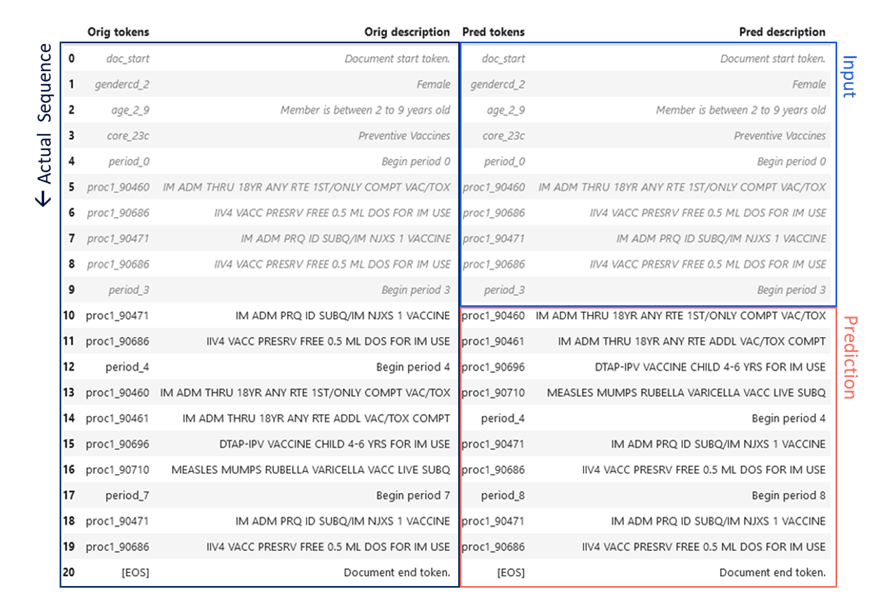
Figure 3 CORE® GPT Clinical Pathways output. The actual sequence of utilization of preventive services for a female age 2-9 is given in the left hand column, spanning two years. The first ten procedures or “tokens” of this sequence (right column, blue) were fed to the CORE® GPT Clinical Pathways model, which predicted the next ten tokens (right column, red).
To develop a more global healthcare QA framework for pathway sequences, we begin with a combination of F1-score and brevity, which penalizes the model for making predictions that are too short. The product of these we term the Certilytics score. We also develop a benchmark using the mode pathway for a given condition; that is, the most common sequence of procedures for a given condition. Comparing CORE® GPT Clinical Pathways score to mode score is analogous to the formulation of R2 as a sum of squares, which compares the performance of a model to the performance of a simple benchmark defined by the mean of the dependent variable. CORE® GPT Clinical Pathways achieves a 3.3-fold increase Certilytics score and a 6.5-fold increase in precision over the pathway mode (Table 4). This is a quantitative demonstration of the ability of CORE® GPT Clinical Pathways to “explain the variance” in condition pathways.
CORE® provides an immediate solution to the problem of characterizing provider treatment patterns. The F1-score for a given member pathway quantifies the agreement between CORE® GPT and pathway. Subtracting F1-score from unity, on the other hand, provides a measure of pathway deviation. By averaging pathway deviation scores across all the pathways attributable to a given specialist provider, we arrive at an overall measure of the deviation of that provider’s practice pattern from the expectation embodied in the CORE® GPT Clinical Pathways model.
We have already integrated this approach into our Provider and Networking dashboards. In particular, stratifying providers of a given specialty—endocrinology, for example—by both treatment deviation and average pathway cost, enables users to identify outlying providers while controlling for the member and provider characteristics that reasonably explain pathway variation (Figure 4).
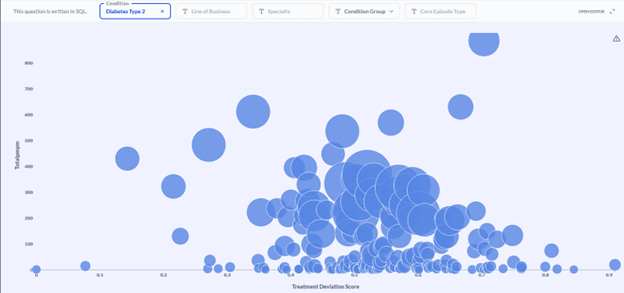
Figure 4 Provider efficacy stratification. Providers (circles) within a specialty (endocrinology in this example) are stratified in two dimensions: the average PMPM cost of a member pathway (diabetes type 2 in this example; y-axis) and the average treatment deviation (x-axis), as determined by the CORE® GPT Clinical Pathways model. High cost, high deviation providers can be found toward the upper right. The size of provider markers is a function of the overall cost allowed.
In the example population shown in Figure 4, investigation of the endocrinologist represented by the upper-right-most bubble yielded clinical verification of his outlier status. He was prescribing GLP-1 inhibitors at a much higher rate than his peers—and at nearly twice the unit cost!
If the mDR and pDR examples show the value of using deep learning to increase the flexibility of inputs to the model, the CORE® GPT Clinical Pathways model shows the value of also increasing flexibility in outputs, going from regression and classification to sequence prediction. Our final example, the ALL-CORE® condition model, provides another example of deep learning expanding the scope of model output.
2022: The ALL CORE® Condition (ACC) model
The All CORE® Condition (ACC) model is, in our view, the apotheosis of member risk modeling. It is a single model built on the CORE® condition grouper that predicts five key member outcomes for every possible condition: diagnosis, cost, ER visits, inpatient admissions, and surgeries (VanMeter, Prybol, and Dwyer 2023)*. That’s over 2,000 predictions! Moreover, condition-level predictions and latent representations are fed forward to the aggregate member level in the same network to provide traditional member risk scores and utilization scores—all optimized concurrently in one enormous multitask learning framework.
Input to the model consists of member documents representing different historic time periods going back up to two years. The model itself is built from GRU and dense vector components, culminating in the 2,000 plus possible multitask targets described. A simplified model architecture representing one of the sub-branches of the model is given in Figure 5 to illustrate the general approach.
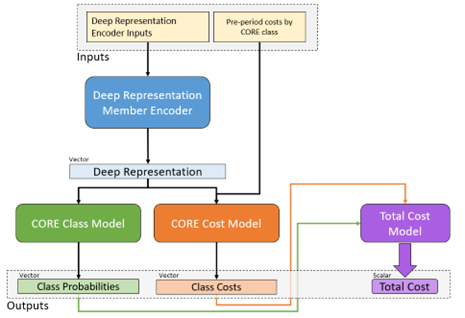
Figure 5 Architecture diagram of a portion of the All-CORE® model. Member histories are represented as documents and subject to a deep learning encoder, which yields a latent layer that can be used as a new mDR. This layer is fed in turn into a model branch predicting class probabilities for new diagnosis of every CORE® condition (green) as well as a model branch predicting the log-transformed future cost for every condition. The resulting predictions are fed forward again into a total cost model at the member level, so the entire network can be optimized at once.
The actual number of reported predictions is smaller—1,049—accounting for the fact that not all conditions are predictable, e.g. appendicitis, and not all have a meaningful prevalence for every outcome, e.g. inpatient admissions for acne. Still, the ACC model provides the most comprehensive set of clinical and financial predictions we have yet encountered in the literature or on the market. To summarize performance (Figure 6) (VanMeter, Prybol, and Dwyer 2023)*:
- Diagnosis with 432 of 438 CORE® conditions can be predicted with a C-statistic of 0.60 or greater.
- Of 366 CORE® conditions with sufficient financial data for modeling, 308 can be predicted with an R2 above 0.05, a threshold based on the performance of age/gender risk models used in the market today.
- Of 171 CORE® conditions with a sufficient prevalence of ER Visits, 151 could be predicted with a C-statistic of 0.60 or greater.
- Of 147 CORE® conditions with a sufficient prevalence of Surgery, 97 could be predicted with a C-statistic of 0.60 or greater.
- Of 85 CORE® conditions with sufficient inpatient admissions, 61 could be predicted with a C-statistic of 0.60 or greater.
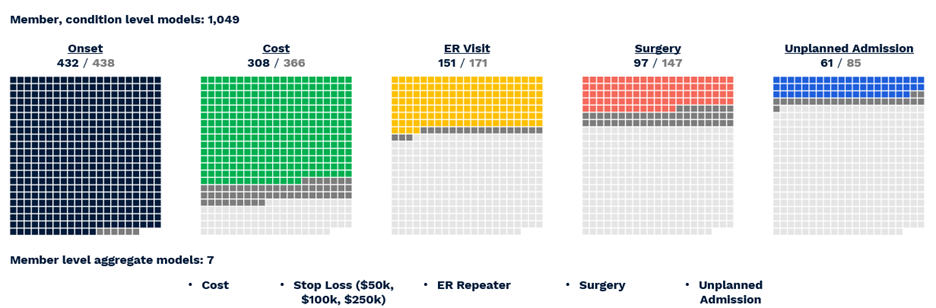
Figure 6 Visual representation of successful All-CORE® model predictions. The number of production grade predictions is given as a fraction of the total number of CORE® conditions (438) which had enough prevalence for a given outcome to be modeled.
2024 and Beyond
Even as deep learning models from the last several years have made their way into production and into products, our Labs team has continued to innovate with particular focus on the payment accuracy space. 2024 will focus heavily on bringing new claim-based payment models to production, leveraging our experience with GenAI algorithms like GPT and other machine translation approaches. We believe claims, as highly non-linear documents, are the natural frontier for deep learning in the administrative healthcare modeling space.
References
Bahdanau, Dzmitry, Kyunghyun Cho, and Yoshua Bengio. 2015. “Neural Machine Translation by Jointly Learning to Align and Translate.” ICLR 2015. https://doi.org/10.48550/arXiv.1409.0473.
Bakarov, Amir. 2018a. “A Survey of Word Embeddings Evaluation Methods.” arXiv. http://arxiv.org/abs/1801.09536.
———. 2018b. “A Survey of Word Embeddings Evaluation Methods.” arXiv. http://arxiv.org/abs/1801.09536.
Cho, Kyunghyun, Bart vanMerrienboer, Caglar Gulcehre, Dzmitry Bahdanau, Fethi Bougares, Holger Schwenk, and Yoshua Bengio. 2014. “Learning Phrase Representations Using RNN Encoder-Decoder for Statistical Machine Translation.” arXiv. https://doi.org/10.48550/arXiv.1406.1078.
Dwyer, Robert, Austin Wright, Saad Zeyana, and Eugene Kwak. 2023. “IP Manifest, Member Deep Representations (mDR).” Certilytics. http://msp2-devapp12:96/research_white_papers/ip_docs/member_deep_rep/.
Hileman, Geof, and Spenser Steele. 2016. “Accuracy of Claims-Based Risk Scoring Models.” Society of Actuaries. https://www.soa.org/4937b5/globalassets/assets/files/research/research-2016-accuracy-claims-based-risk-scoring-models.pdf.
Le, Quoc V., and Tomas Mikolov. 2014. “Distributed Representations of Sentences and Documents.” arXiv. http://arxiv.org/abs/1405.4053.
Mikolov, Tomas, Kai Chen, Greg Corrado, and Jeffrey Dean. 2013. “Efficient Estimation of Word Representations in Vector Space.” arXiv. http://arxiv.org/abs/1301.3781.
Prybol, Kevin, and Robert Dwyer. 2020. “Integrating Provider History into a Patient HCC Model: Knowledge Transfer via Provider Deep Representation (pDR).” Certilytics. http://msp2-devapp12:96/research_white_papers/white_papers/knowledge_transfer_via_provider_vectors/.
Radford, Alec, and Karthik Narsimhan. 2018. “Improving Language Understanding by Generative Pre-Training.” https://cdn.openai.com/research-covers/language-unsupervised/language_understanding_paper.pdf.
Torregrossa, Francois, Vincent Claveau, Nihel Kooli, Guillaume Gravier, and Robin Allesiardo. 2020. “On the Correlation of Word Embedding Evaluation Metrics.” In Proceedings of the Twelfth Language Resources and Evaluation Conference, Proceedings of the Twelfth Language Resources and Evaluation Conference:4789–97. Marseille, France: European Language Resources Association. https://aclanthology.org/2020.lrec-1.589.
VanMeter, P. 2022. “CORE Trajectories: Overview of Clustering Methodologies.” Ds-Docs, August. http://msp2-devapp12:96/research_white_papers/white_papers/clustering_methodology/.
VanMeter, P. D. 2022. “Intrinsic Evaluation of Deep Representations and Implications for Rx Code Tokenization.” ds-docs. http://msp2-devapp12:96/research_white_papers/white_papers/deep_representation_intrinsic_evaluation/.
VanMeter, Patrick. 2023. “Pre-Training the CertLM Encoder Model.” Certilytics Internal.
VanMeter, Patrick, Kevin Prybol, and Robert Dwyer. 2023. “CORE Deep Learning All-in-One Model (Model Suite V5).” Certilytics. http://msp2-prdapp15:8080/tfs/TFS_CertilyticsCollection/TFS-Certilytics/_git/ds-docs?path=%2Fdocs%2Fresearch_white_papers%2Fwhite_papers%2Fcore_dl_introduction.md&version=GBdev-pdv&_a=contents.
Wang, Bin, Angela Wang, Fenxiao Chen, Yuncheng Wang, and C.-C. Jay Kuo. 2019. “Evaluating Word Embedding Models: Methods and Experimental Results.” APSIPA Transactions on Signal and Information Processing 8 (1): 1–14. https://doi.org/10.1017/ATSIP.2019.12.